You are here
20201212-sensor.jpg

Media Folder
Title
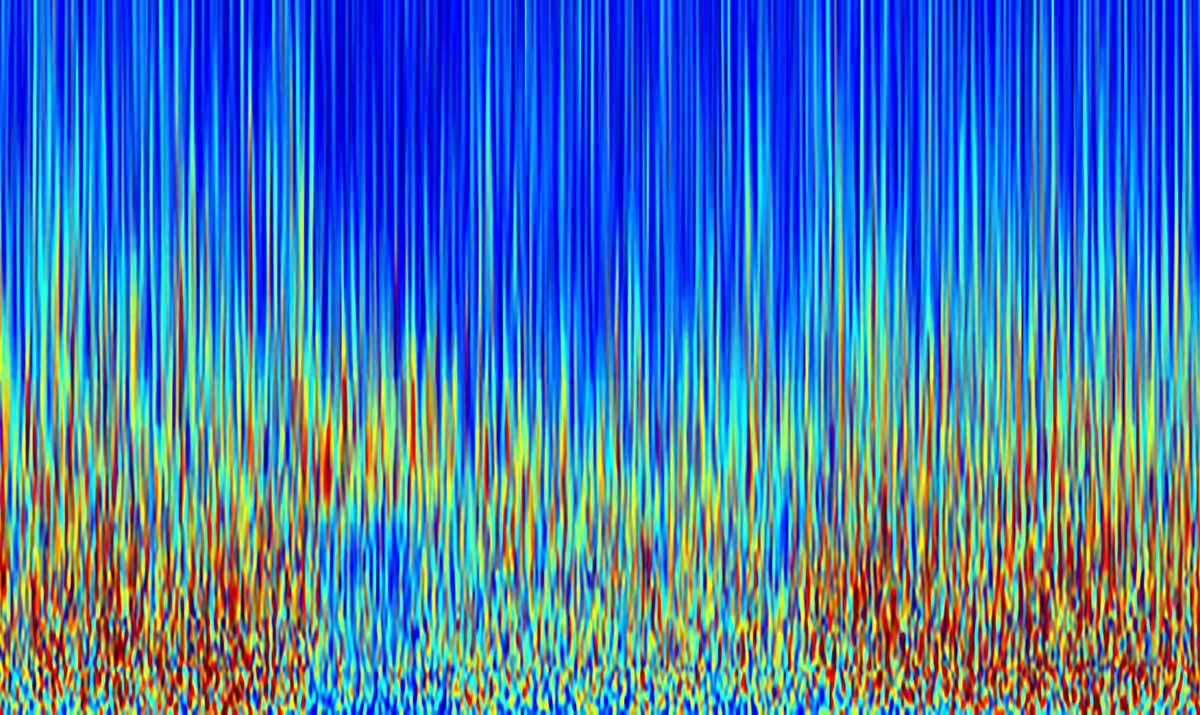
Scans of mouse brain serotonin levels during different stages of sleep and wakefulness. Thick red and yellow streaks represent lower levels while thin ones represent higher levels.
Caption
NIH BRAIN Initiative-funded scientists used artificial intelligence to help redesign a nutrient grabbing, Venus flytrap-shaped bacterial protein into a highly sensitive serotonin sensor. Here the sensor captured for the first time subtle, real time changes in brain serotonin levels as mice transitioned between different stages of sleep and wakefulness.
Credit
Tian lab. University of California Davis School of Medicine.
Description
Scans of mouse brain serotonin levels during different stages of sleep and wakefulness. Thick red and yellow streaks represent lower levels while thin ones represent higher levels.
Site_Section
Alt Text
Scans of mouse brain serotonin levels during different stages of sleep and wakefulness. Thick red and yellow streaks represent lower levels while thin ones represent higher levels.
