You are here
20201223-wave.jpg

Media Folder
Title
Mapping out the Brain’s GPS
Caption
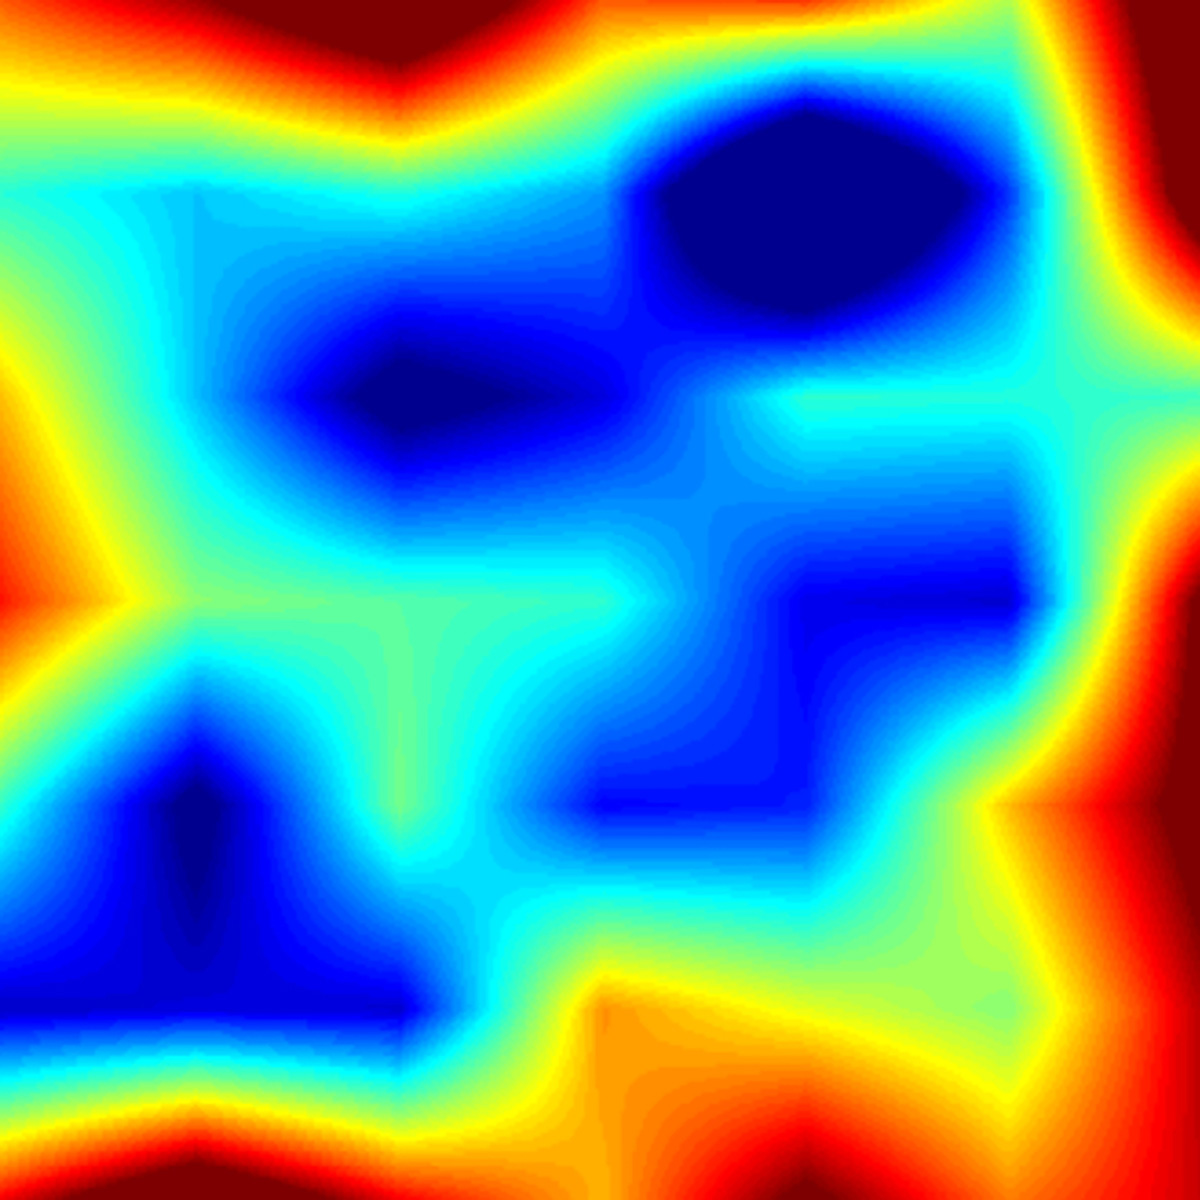
NIH BRAIN Initiative-funded researchers used a special backpack to wirelessly monitor the brain waves of epilepsy patients as they searched for a hidden spot in an empty square room.
Credit
Courtesy of Suthana lab, UCLA.
Description
Heat map of average brain wave activity recorded as volunteer epilepsy patients walked around a room searching for a hidden spot. Red represents strongest theta wave activity while blue represents weakest.
Site_Section
Alt Text
Heat map of average brain wave activity recorded as volunteer epilepsy patients walked around a room searching for a hidden spot. Red represents strongest theta wave activity while blue represents weakest.
