You are here
20211006-tolias-nature.jpg

Media Folder
Title
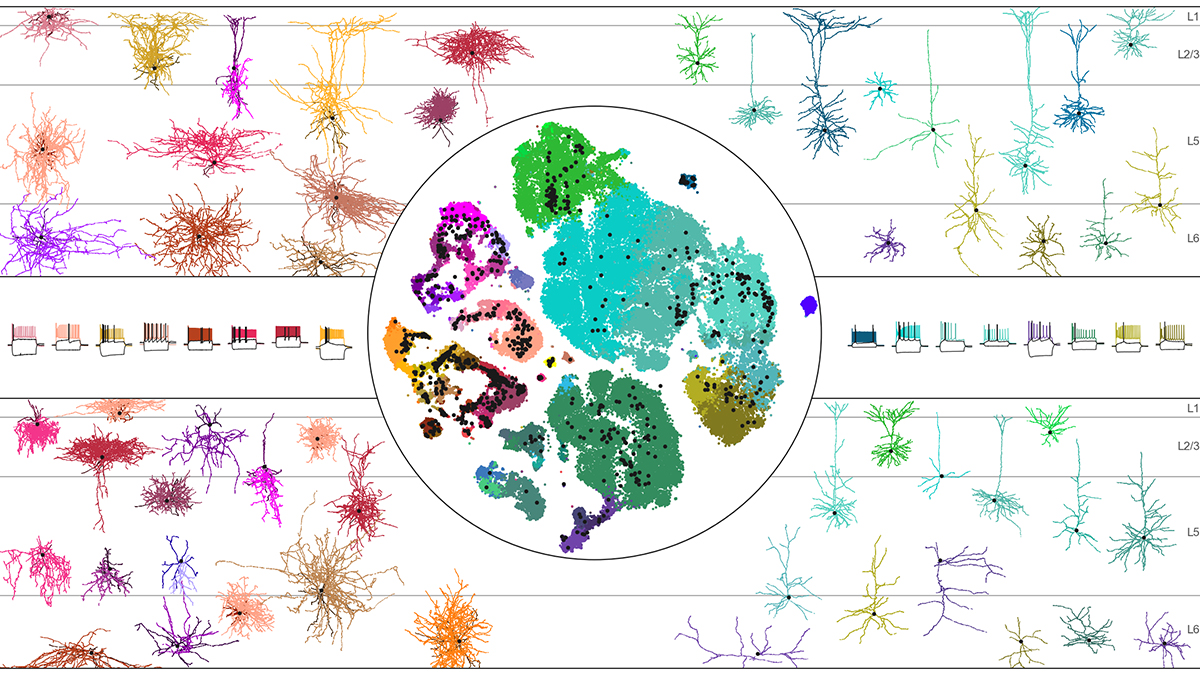
A central circle with multiple colored patches inside. The colored patches represent a visualization of the mouse MOp transcriptomic taxonomy. The colored patches are overlaid with small black dots representing mapped neuronal cells. Surrounding the centr
Caption
A multicolor visualization of the mouse MOp transcriptomic taxonomy overlaid with mapped neuronal cells surrounded by color-coordinated pictures of different types of neurons (GABAergic, glutamatergic, chandelier, etc.) and their electrophysiological signatures.
Credit
Tolias/Nature
Description
A central circle with multiple colored patches inside. The colored patches represent a visualization of the mouse MOp transcriptomic taxonomy. The colored patches are overlaid with small black dots representing mapped neuronal cells. Surrounding the central circle are pictures of various types of neurons in colors that coordinate with the patches used in the central circle (pinks on left and greens and blues on the right). Interspersed with the images of the neurons are spike graphs showing neuron electrophysiological profiles.
Site_Section
Alt Text
A central circle with multiple colored patches inside. The colored patches represent a visualization of the mouse MOp transcriptomic taxonomy. The colored patches are overlaid with small black dots representing mapped neuronal cells. Surrounding the centr
